A unified engineering command center that gives a cloud AI agency real-time visibility across every production service — from auth to AI inference — with sub-minute incident detection and zero framework overhead.
A cloud AI agency running 15+ production services had no unified visibility. Keycloak, NocoDB, n8n, MinIO, and a FastAPI bridge each had their own dashboards, logs, and alert paths — or none at all. The ops team was checking services individually, on rotation, by memory.
The mean time to detect an incident was over 10 minutes. In most cases, a client reported the issue first. There was no single pane of glass that could answer the most basic question: is everything running right now?
The team also had no quick-access layer for operational tasks. Routine actions — checking deployment status, pulling a service log, triggering a workflow — required navigating four or five separate admin UIs. There was no AI assistant wired into internal context, no command launcher, no alert routing to Discord.
Every escalation path was manual. Every status check was a tab-switch. The tooling was not keeping pace with the complexity of what it was supposed to operate.
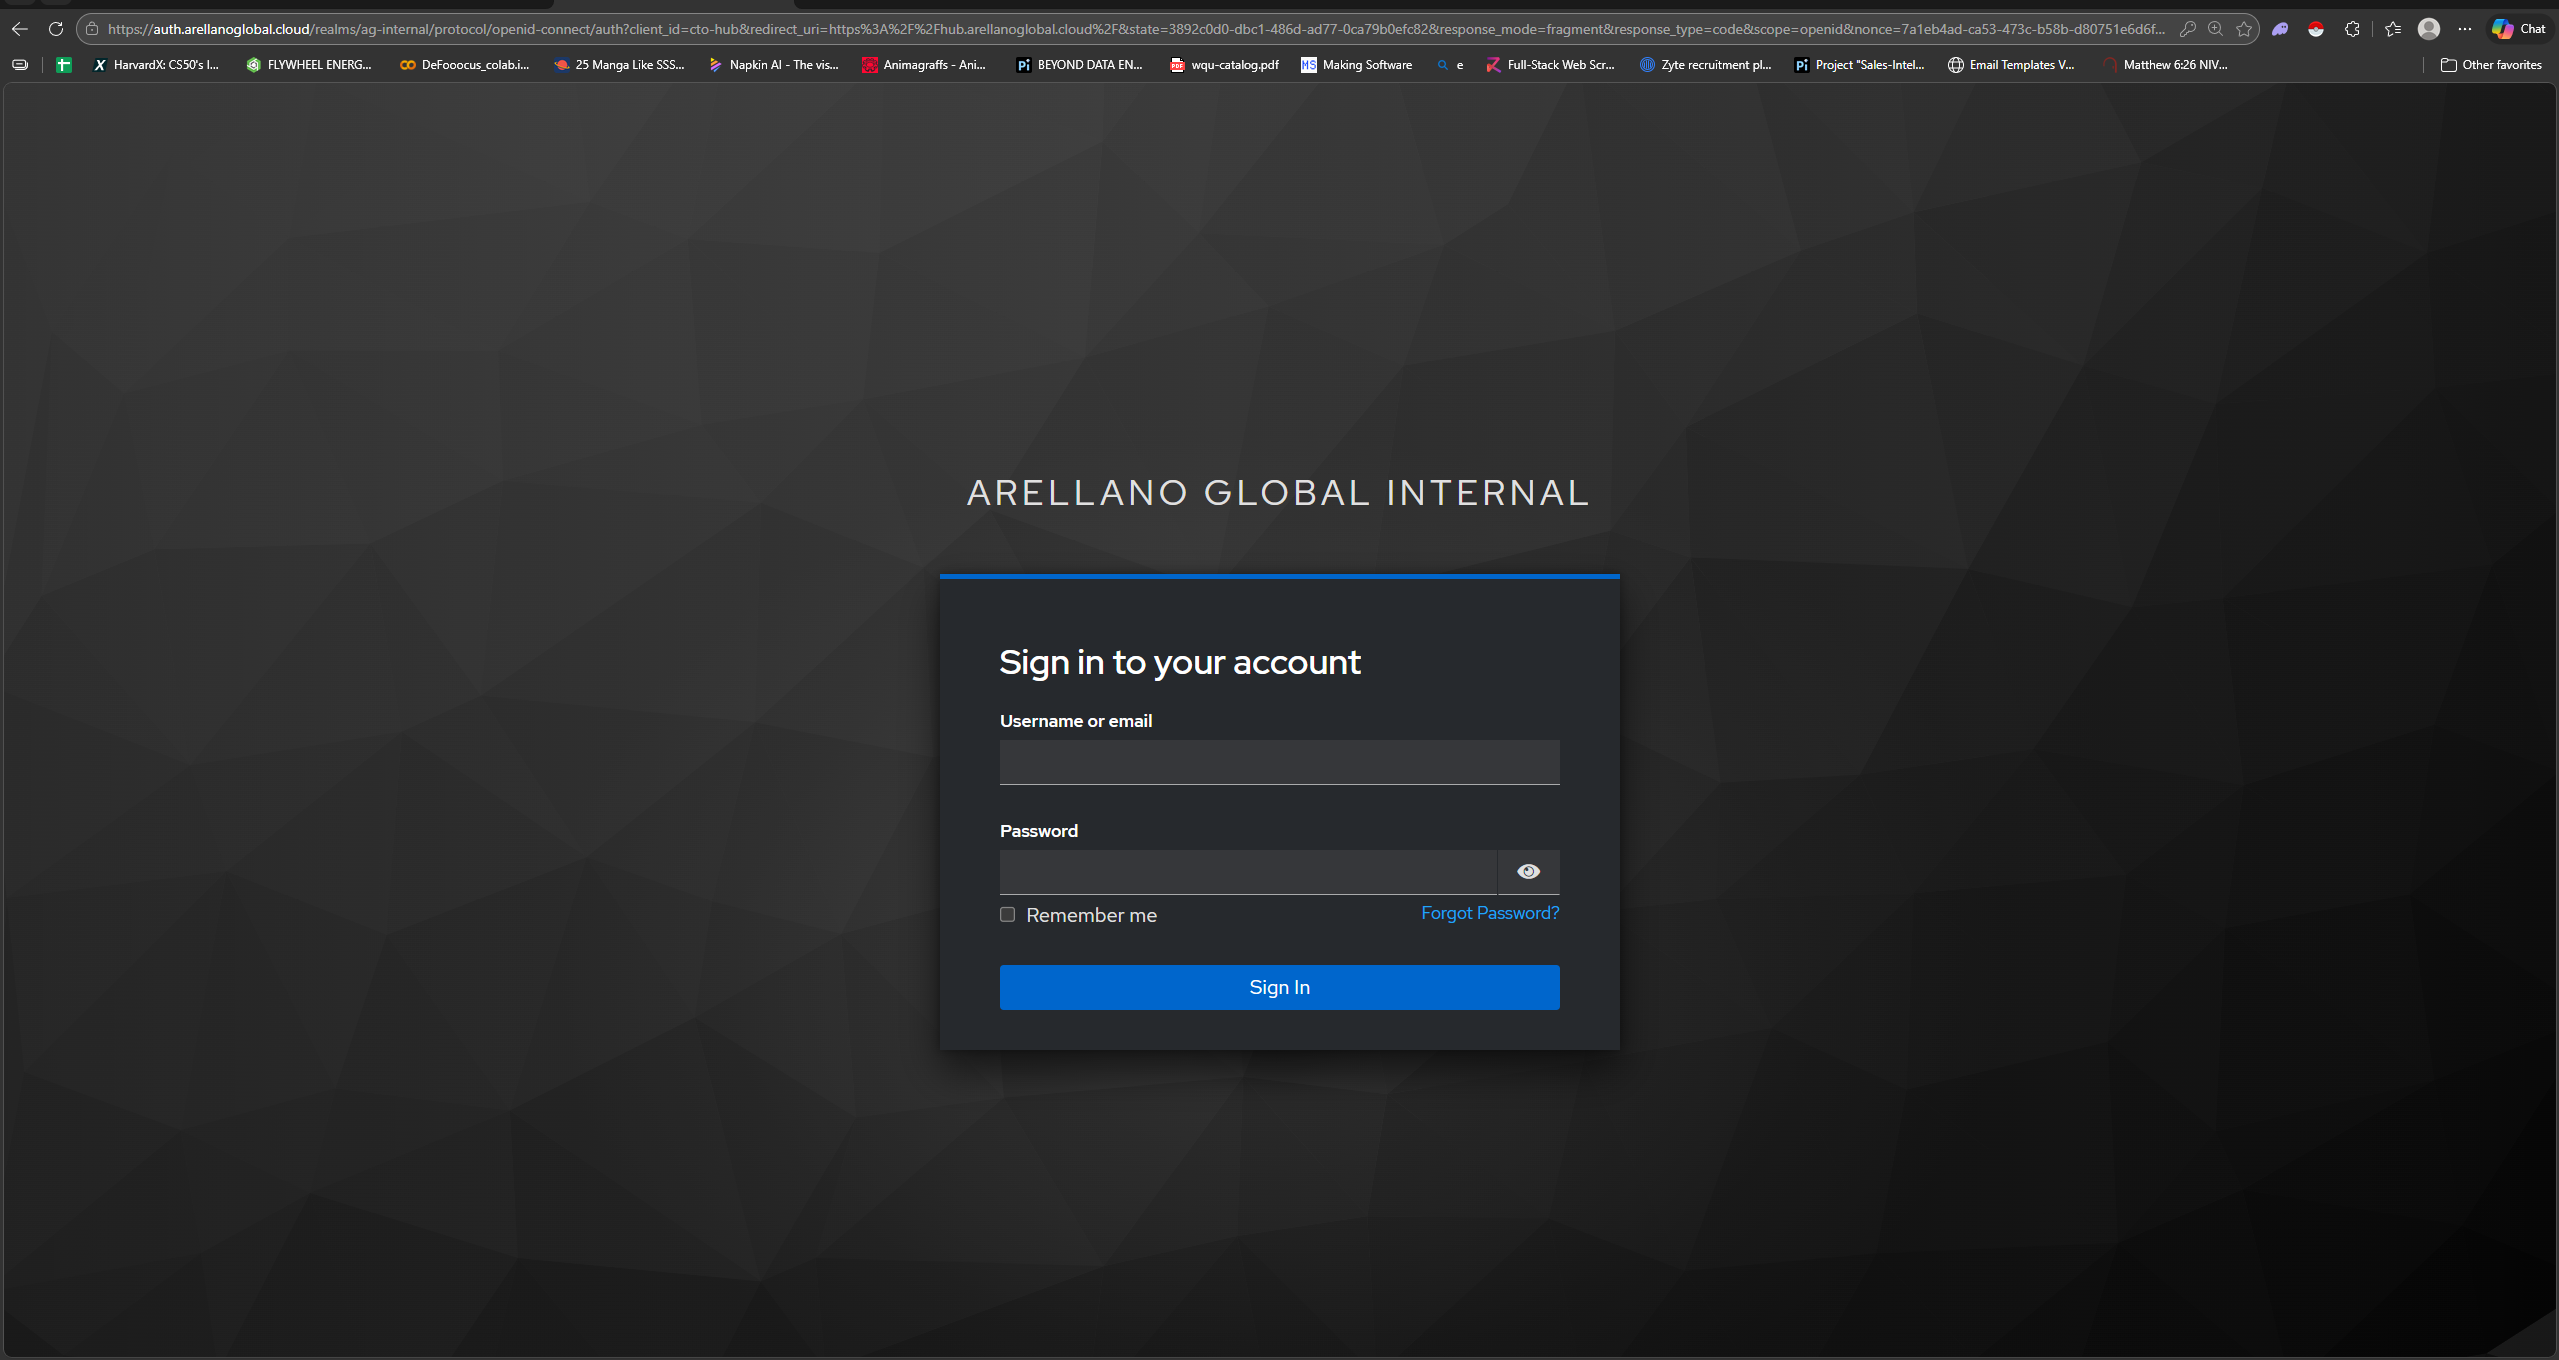
The hub is a Vanilla JS SPA served by nginx behind Traefik SSL. Auth flows through Keycloak 26 PKCE. All AI and data calls route through a FastAPI bridge that enforces JWT isolation, circuit breaking, and rate limiting before touching backend services.
Each layer of the hub was designed to solve a distinct operational problem. Together they form an always-on command surface that replaces manual tab-switching with a single authenticated dashboard.
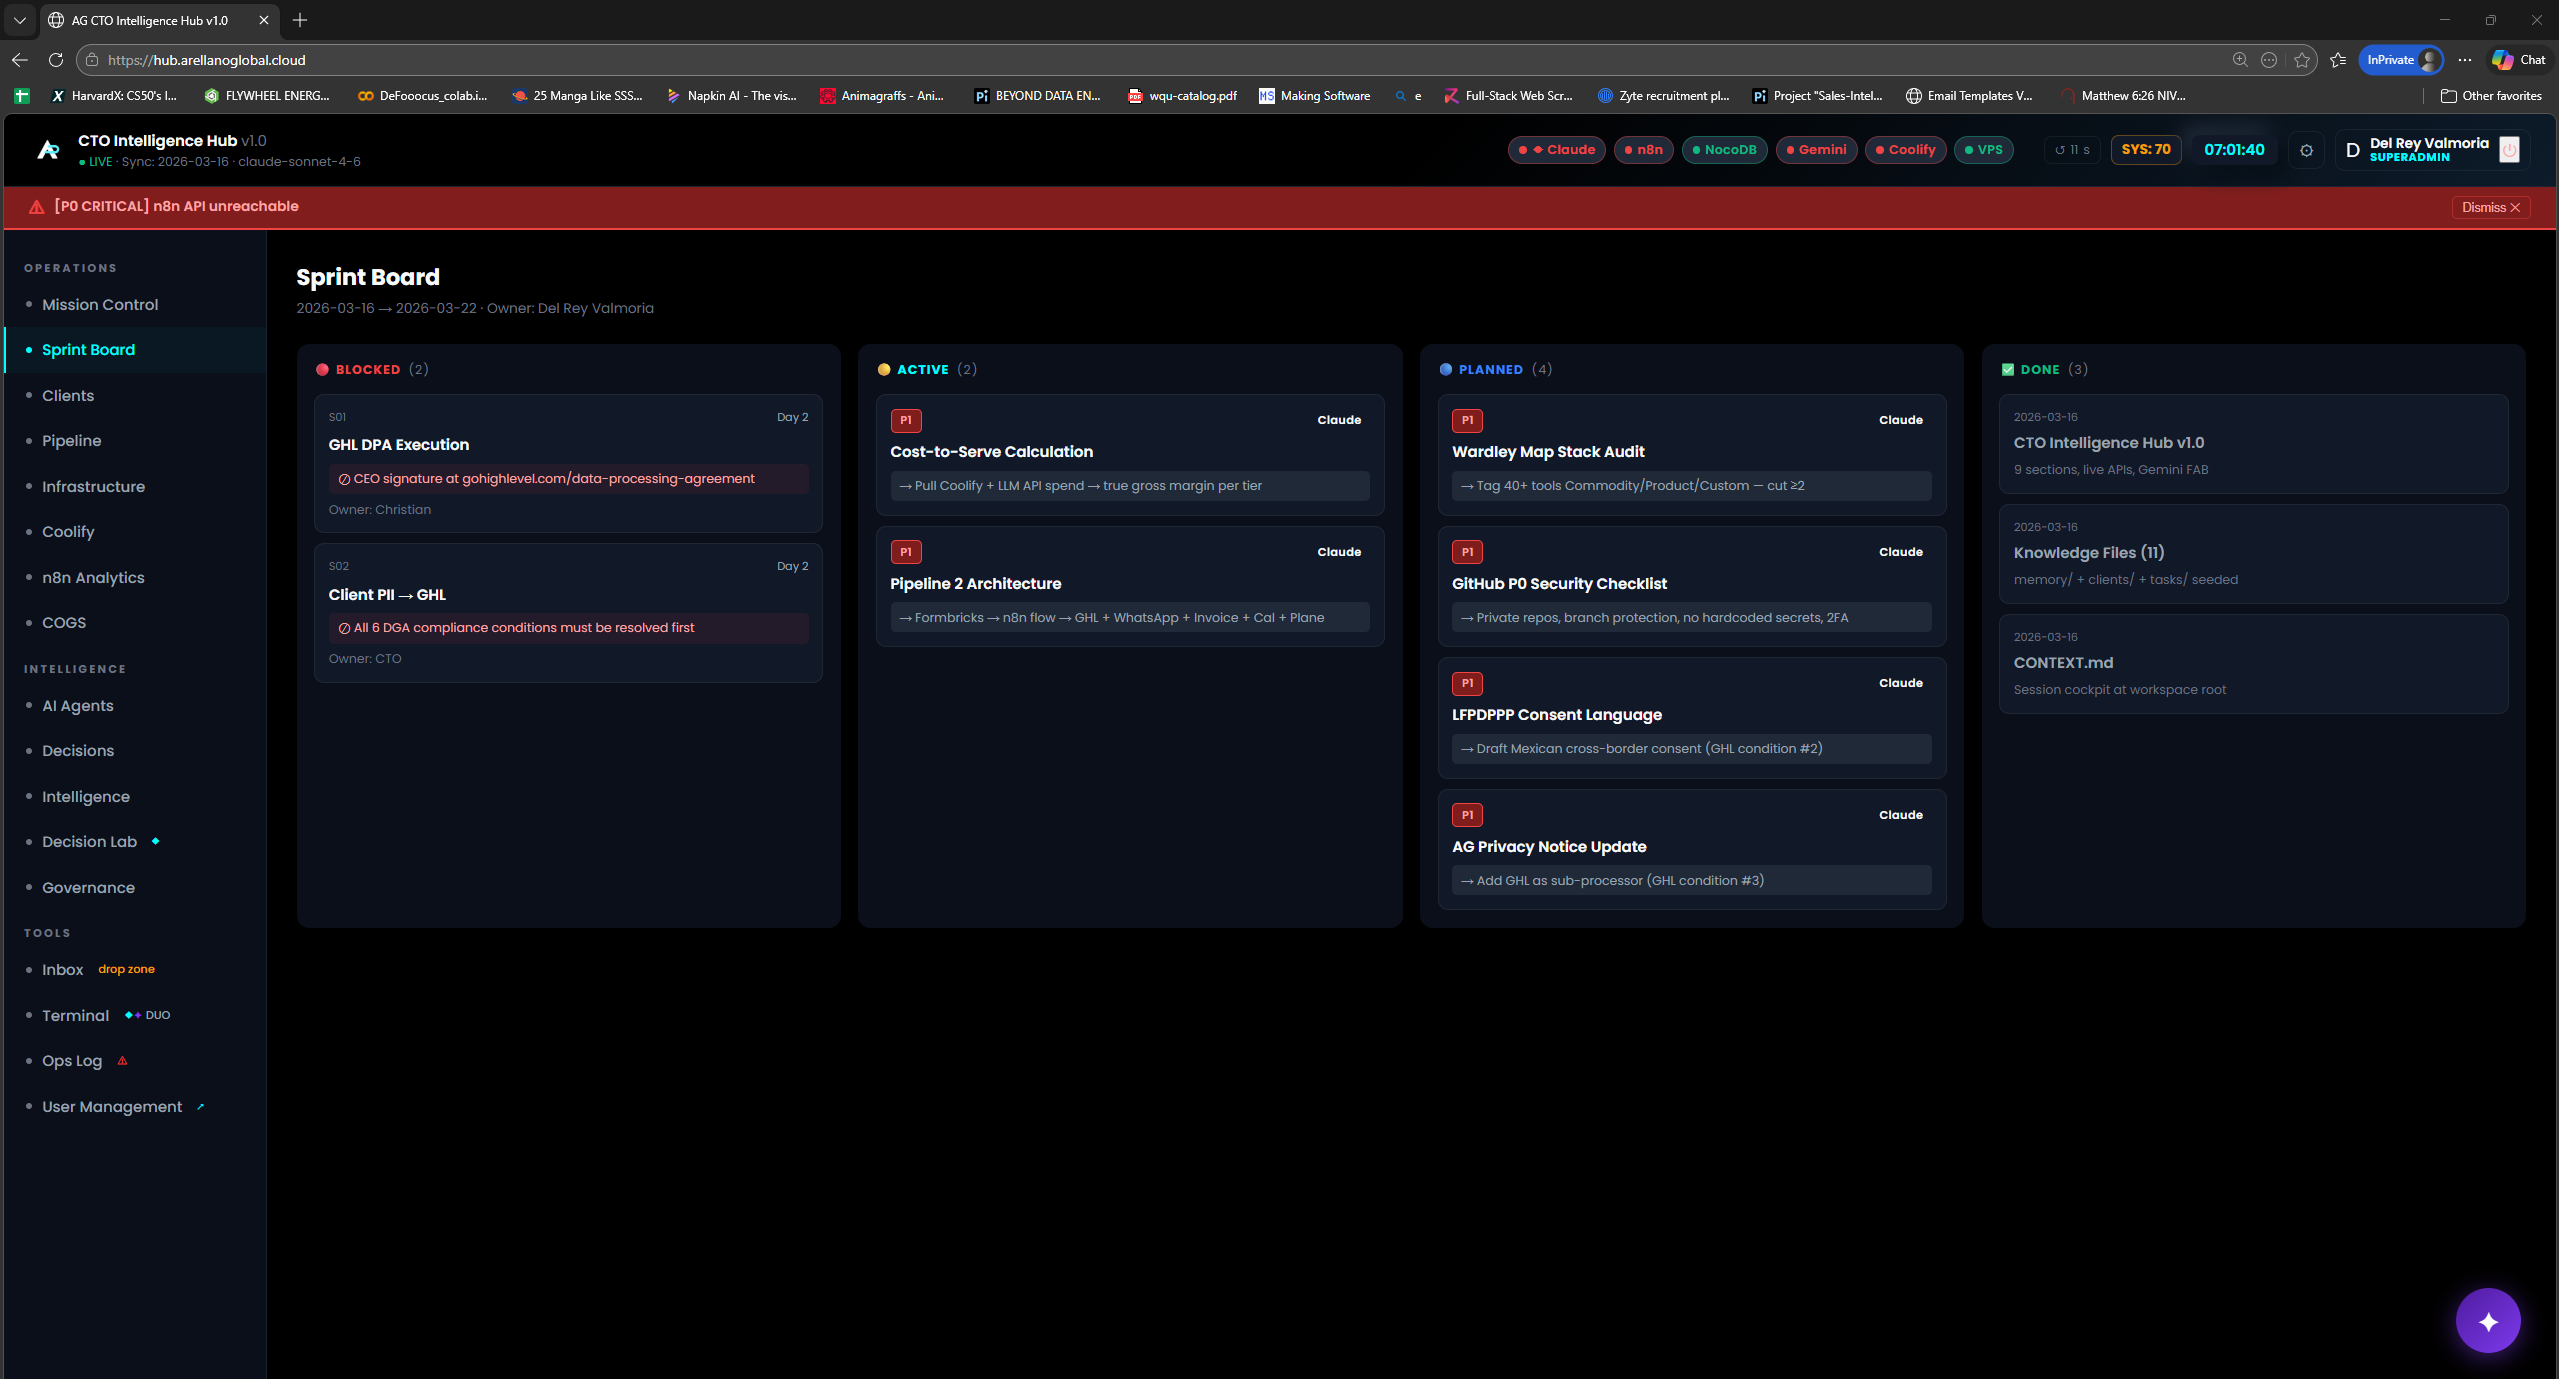
RUNNING:HEALTHY → running) prevents false P0 alerts
from Coolify's compound status strings. Any red pill fires a Discord
alert through the AG Observability error handler.
Before this ribbon, mean detection time was 10+ minutes.
After: under one minute.
Every architectural decision was made against a concrete alternative. Here are the three that most defined the system's character.
An internal ops tool is loaded dozens of times per day by a small team. Every second of load time is engineer-hours lost. A React SPA with a Vite build pipeline adds ~150-300 KB of JS before a single component renders. Vanilla JS with DOM APIs loads the entire hub in under 200ms on the internal network. No build step means instant iteration — edit a file, refresh, done. The trade-off (no component model, manual DOM management) is acceptable for a single-team internal tool with well-defined, stable UI sections.
+150-300 KB bundle · build step required · npm dependency surface · hydration overhead
Zero bundle · instant load · no build pipeline · direct DOM · zero dependencies
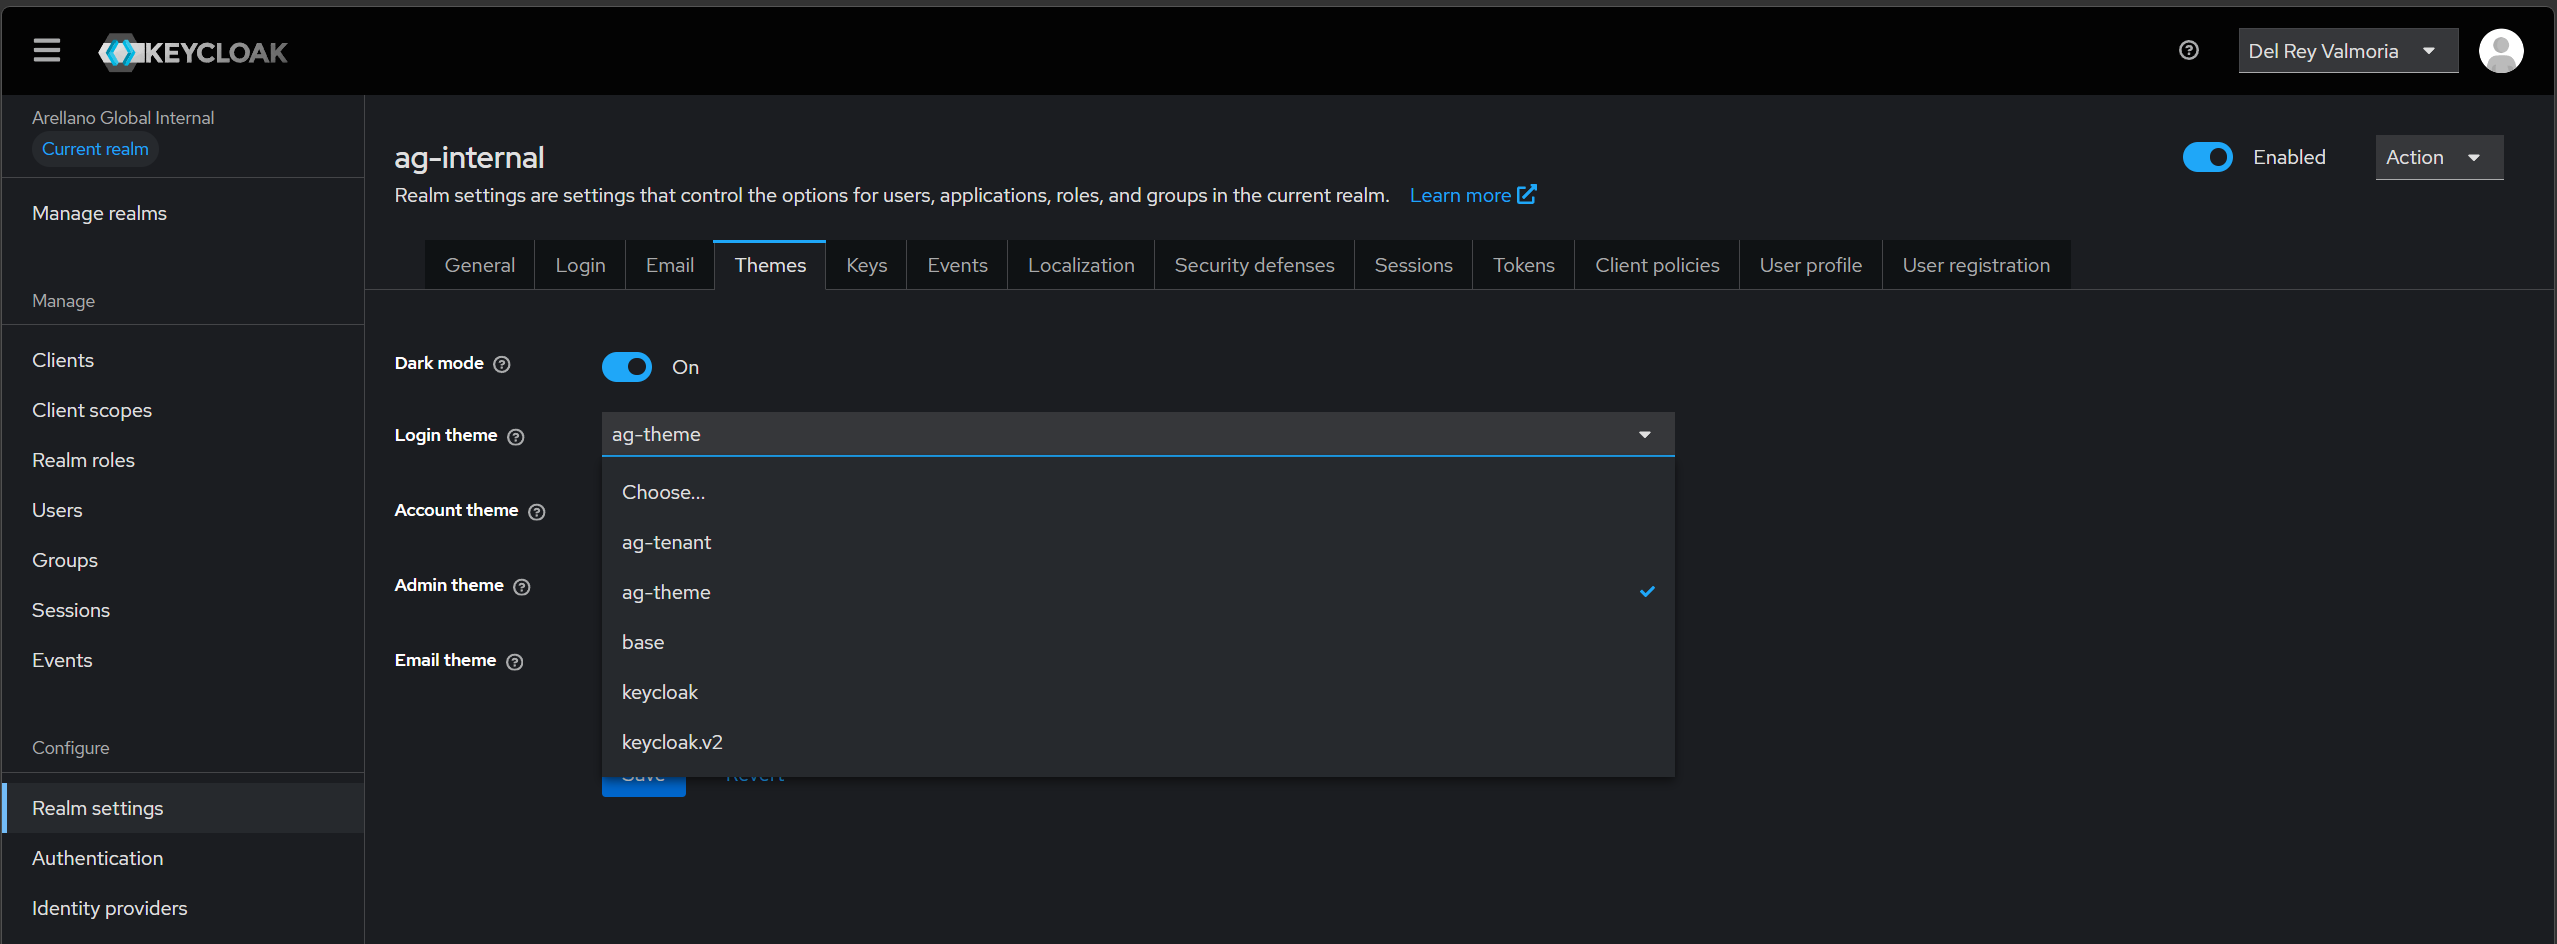
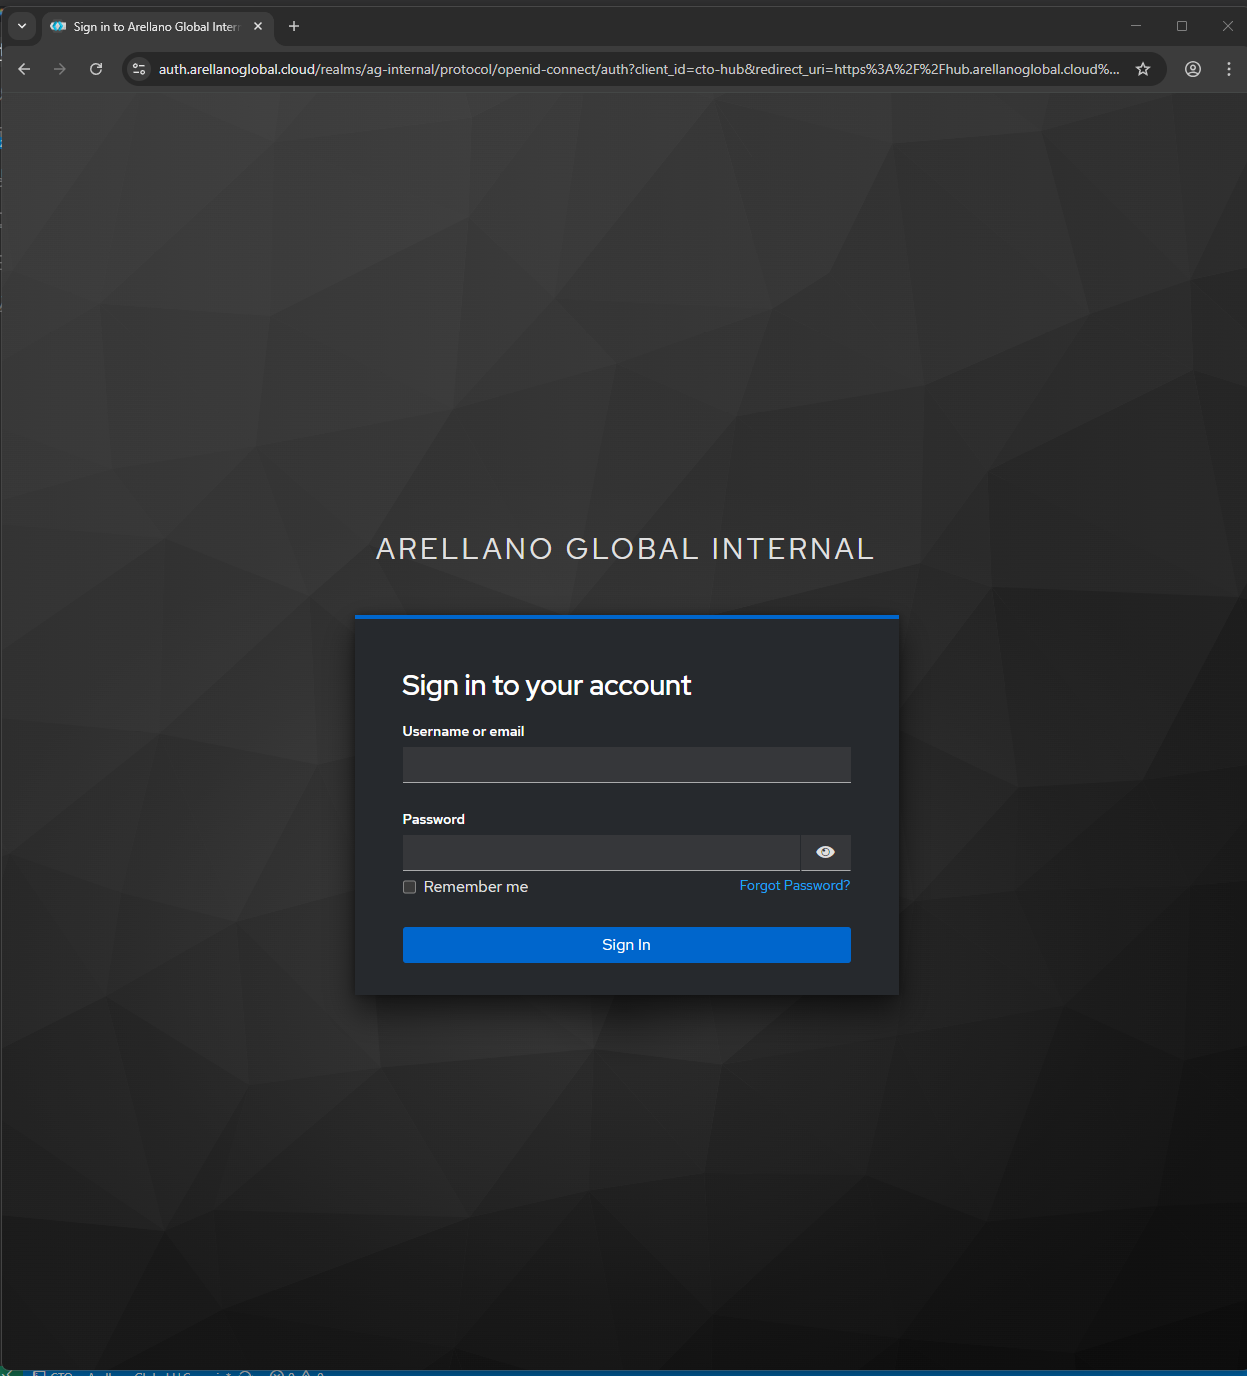
Auth0 and Clerk both charge per monthly active user (MAU) — costs that scale with team size regardless of usage patterns. More critically, neither allows the level of token control, realm isolation, or custom login theme that a multi-tenant agency platform requires. Keycloak 26 runs on the same self-hosted infrastructure as all other services. It supports PKCE S256, TOTP MFA, per-realm role sets, and a fully custom FreeMarker login theme (ag-tenant) that matches brand identity. The operational cost is one PostgreSQL database and one Docker container.
Per-MAU pricing · limited realm isolation · no custom SMTP control · SaaS lock-in
Zero MAU cost · full PKCE · TOTP MFA · custom theme · multi-realm · self-hosted
The alternative was calling Gemini, NocoDB, and Coolify directly from the browser JS — exposing API keys in client-side code and bypassing any rate-limiting or circuit-breaking logic. The FastAPI bridge creates a single JWT-authenticated entry point. Every outbound call to a backend service is made server-side with service credentials that never reach the browser. The bridge also implements a circuit breaker for Gemini (preventing runaway inference spend during outages) and exposes a /metrics Prometheus endpoint for latency and error rate tracking.
API keys exposed client-side · no rate limiting · no circuit breaker · no metrics
JWT-isolated · circuit breaker · Redis session cache · Prometheus /metrics endpoint
The hub went from zero to production in a single sprint. The metrics below represent the delta between the pre-hub baseline and steady-state operation after the health ribbon, command palette, and AI rail were fully wired.
Dashboard Interface
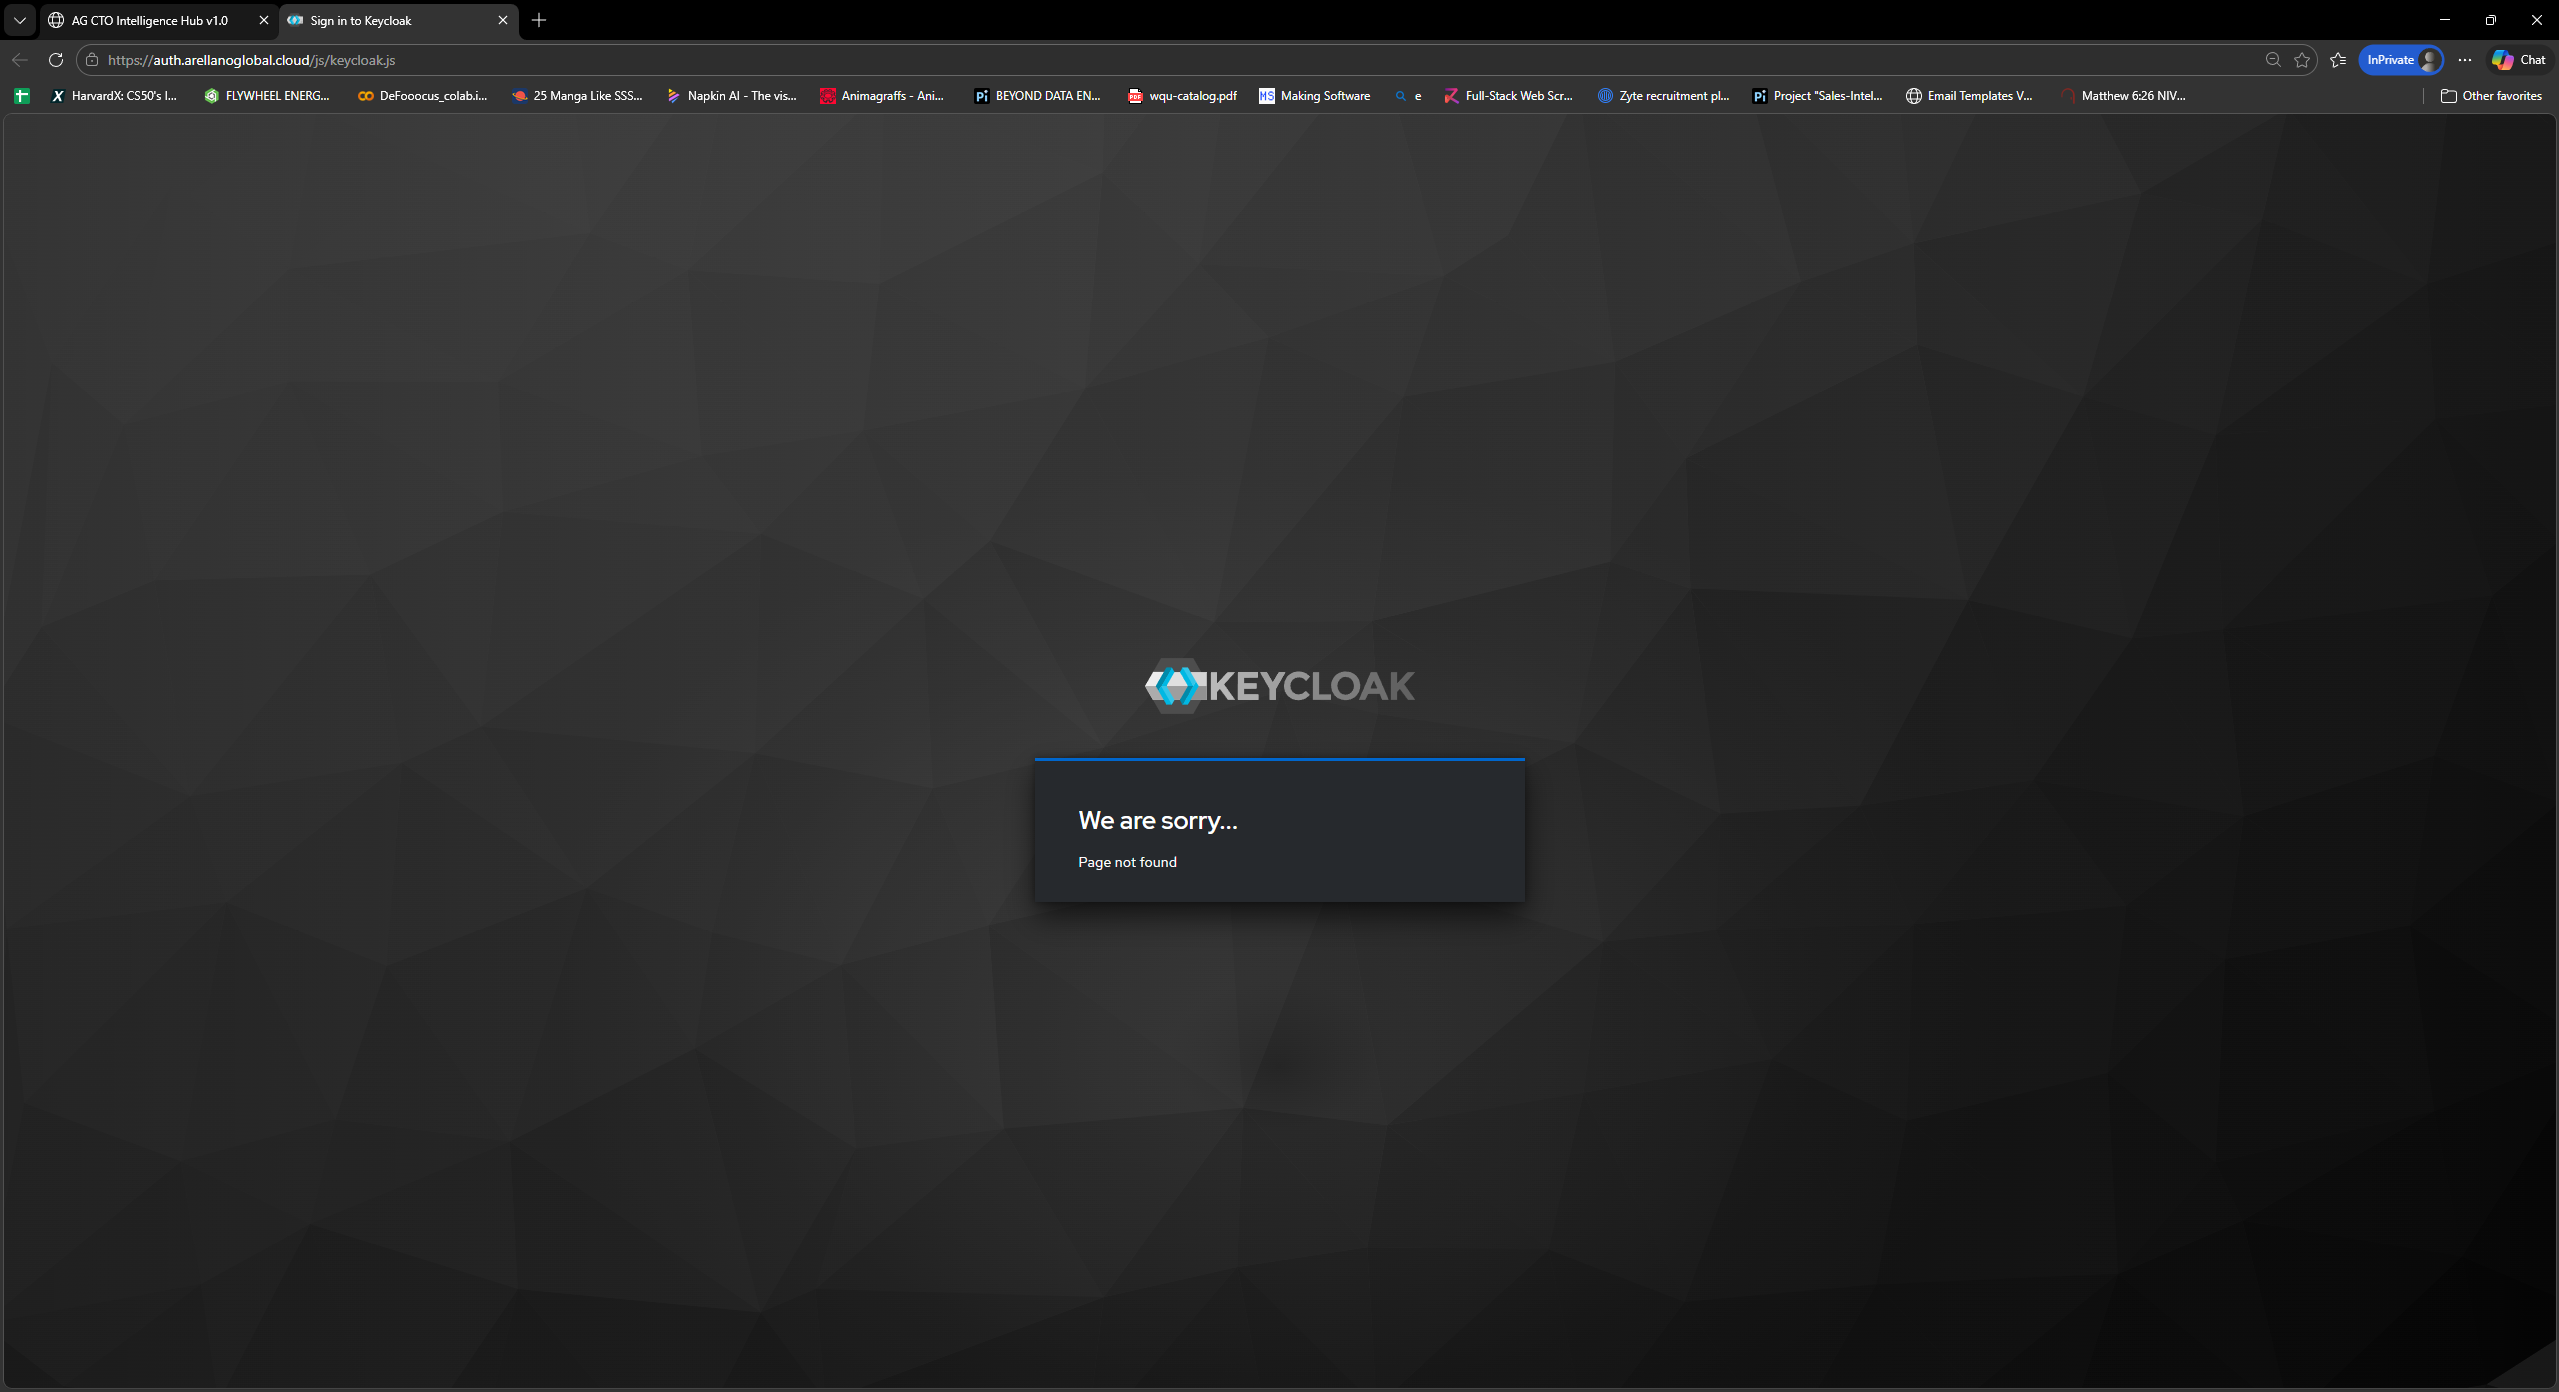
The hub's primary view: a 28px health ribbon at the top with live service status pills, followed by a service card grid showing deployment state, version, and uptime per service.
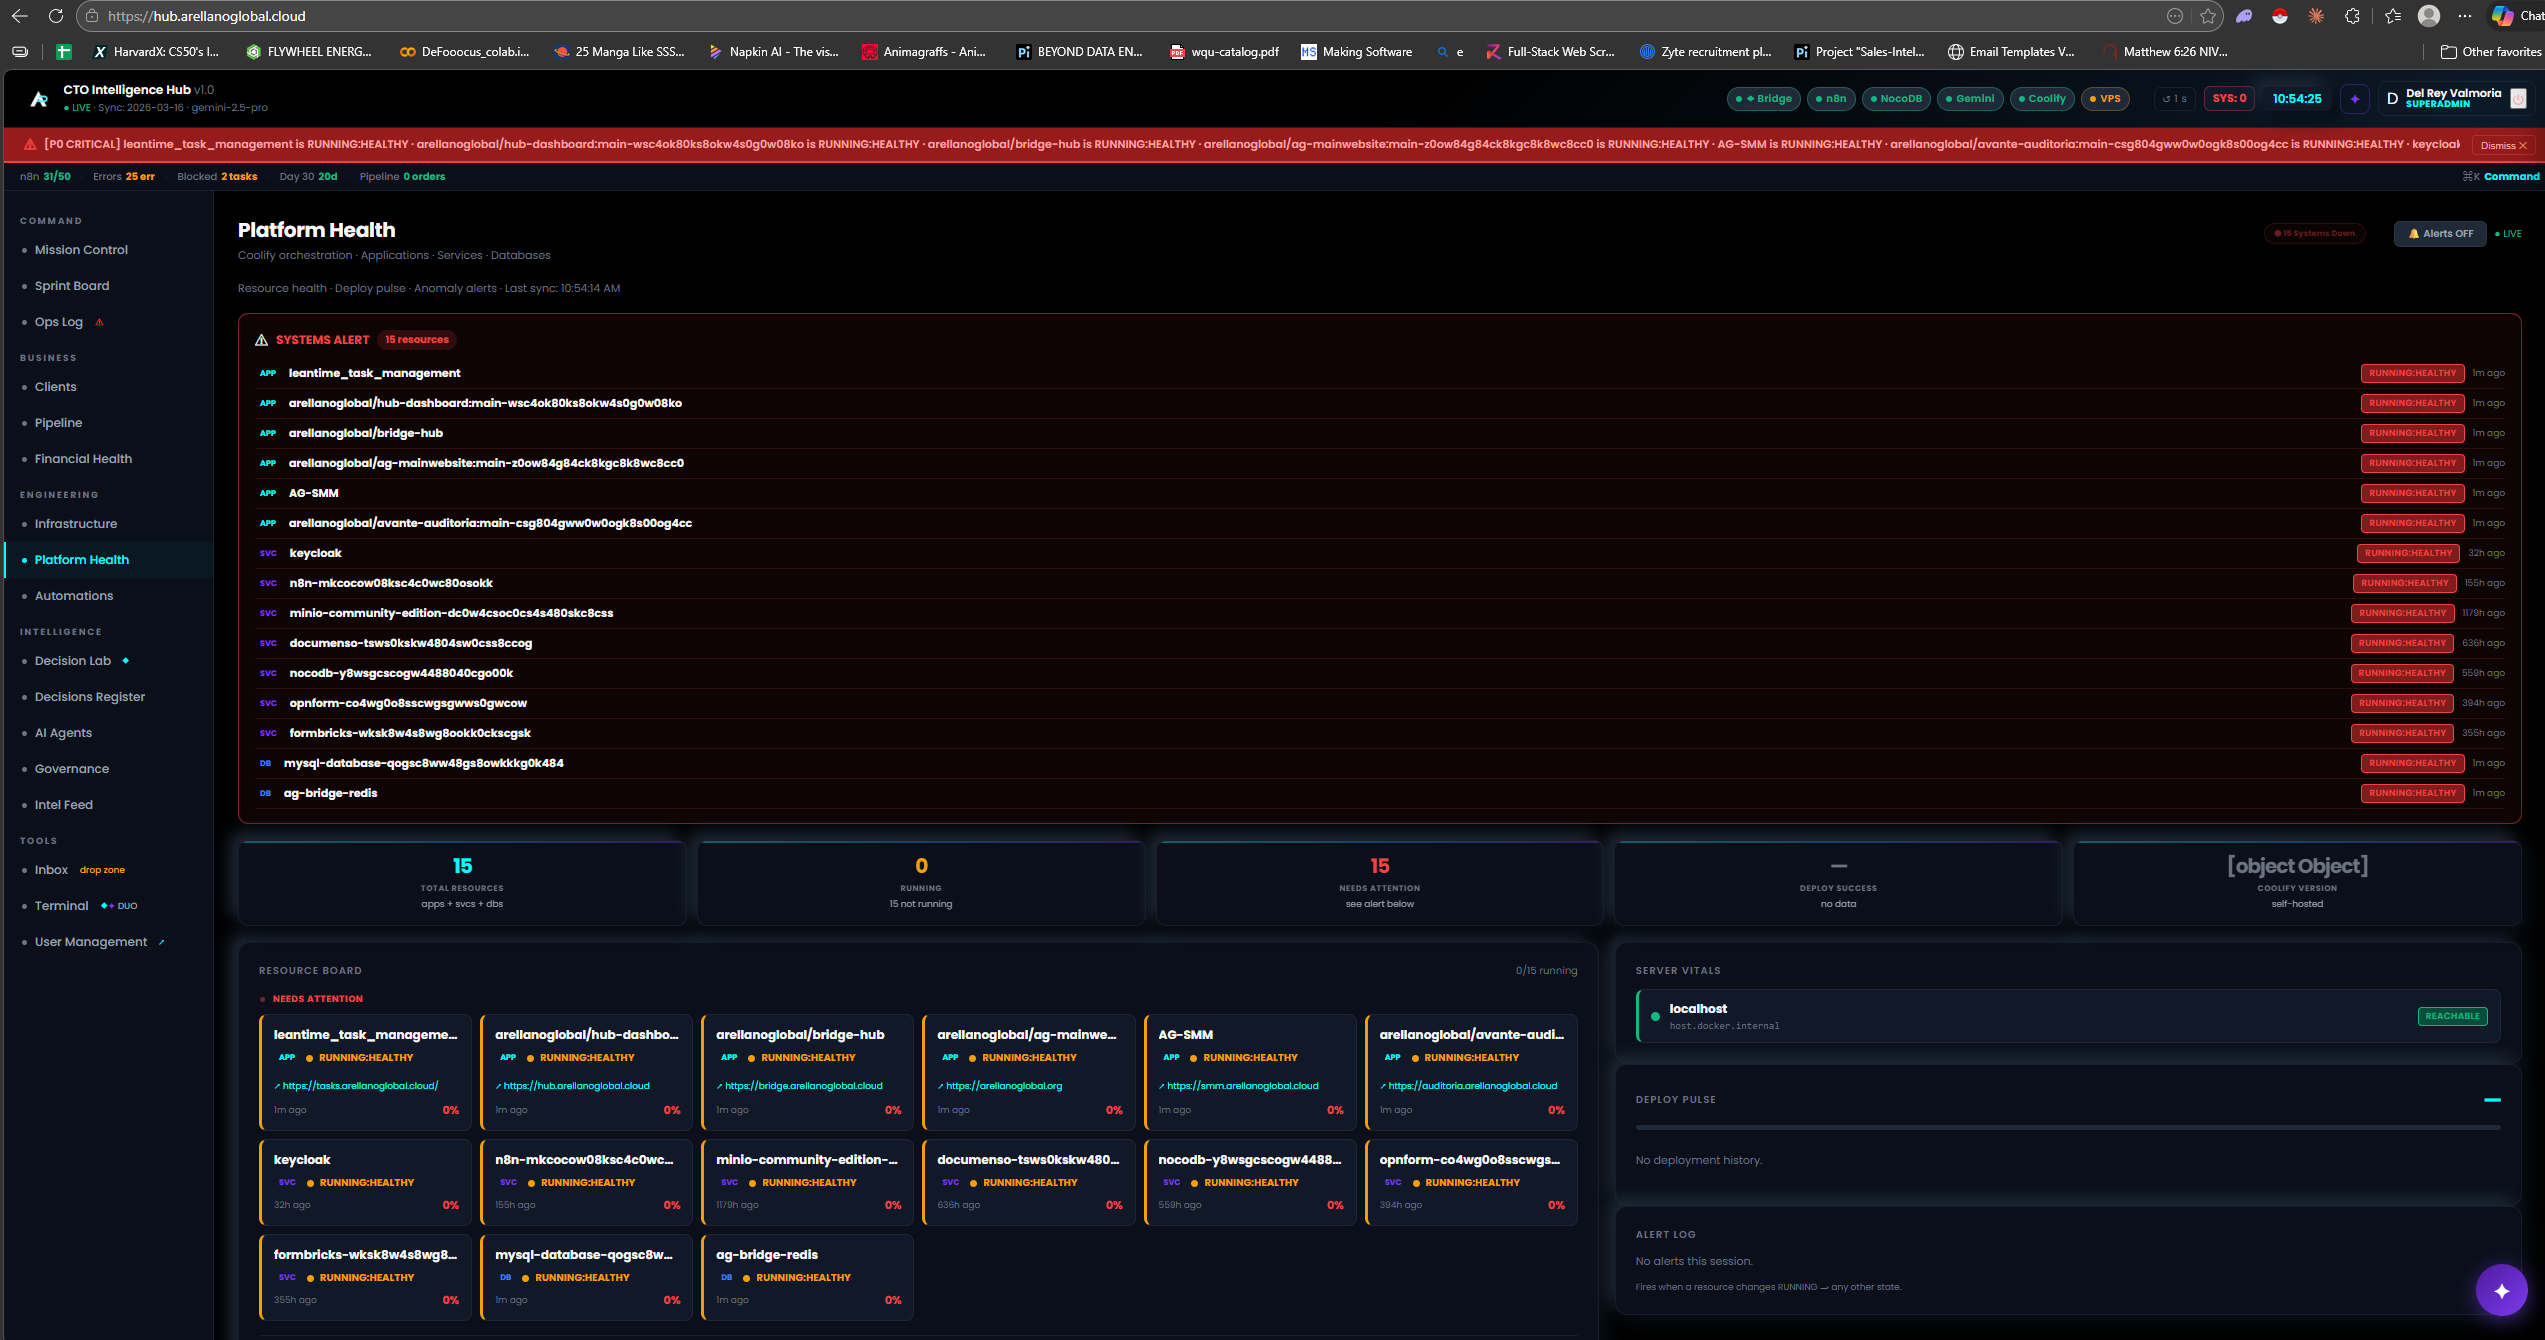
LIVE — app.arellanoglobal.org
Command Palette
The command palette overlays the dashboard on Ctrl+K. Fuzzy search filters 18 commands across five groups in real time.
CTRL+K COMMAND PALETTE — 18 COMMANDS
Operational Impact
The health ribbon polls five critical service endpoints every 30 seconds and routes any degraded status directly to Discord. Before the hub, incident detection relied on manual checks or client reports — averaging 10+ minutes. The ribbon cut that to under 60 seconds for any observable failure in the monitored stack.
Coolify, n8n, NocoDB, service logs, and deployment status are all reachable via the Ctrl+K palette in under two keystrokes. The 18-command set covers 100% of the team's routine operational actions.
The Gemini AI rail is wired into service state. The team asks questions in natural language and gets answers grounded in live infrastructure context, without context-switching to a separate chat tool.
The Vanilla JS architecture means zero build pipeline and under 200ms load time on the internal network. Any engineer can edit the dashboard and see changes on refresh — no npm install, no build step, no hot-reload config.
Notification recipients are managed through the hub UI itself, stored in NocoDB, and cached with a 5-minute Redis TTL. Adding or removing an alert recipient takes 10 seconds and requires no infrastructure change.
I design and build engineering command systems for cloud-native teams — real-time observability, auth, AI assistants, and zero-framework ops tooling.
Get in Touch →Screenshots captured during live build — from early dashboard to v2.3 with Health Ribbon and Command Palette.
HUB — LIVE PRODUCTION